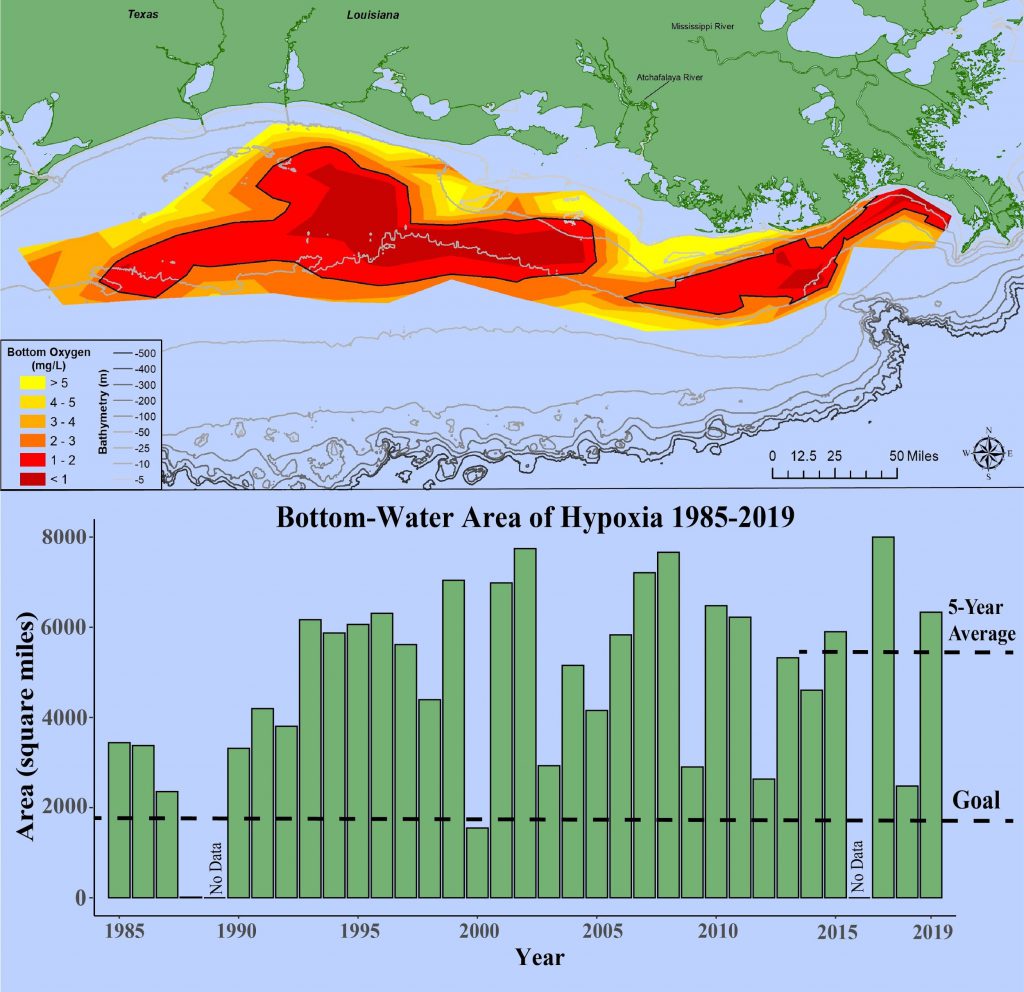
NCCOS-supported scientists have determined that this year’s Gulf of Mexico “dead zone”—an area of low oxygen that can kill fish and marine life—is approximately 6,952 square miles.
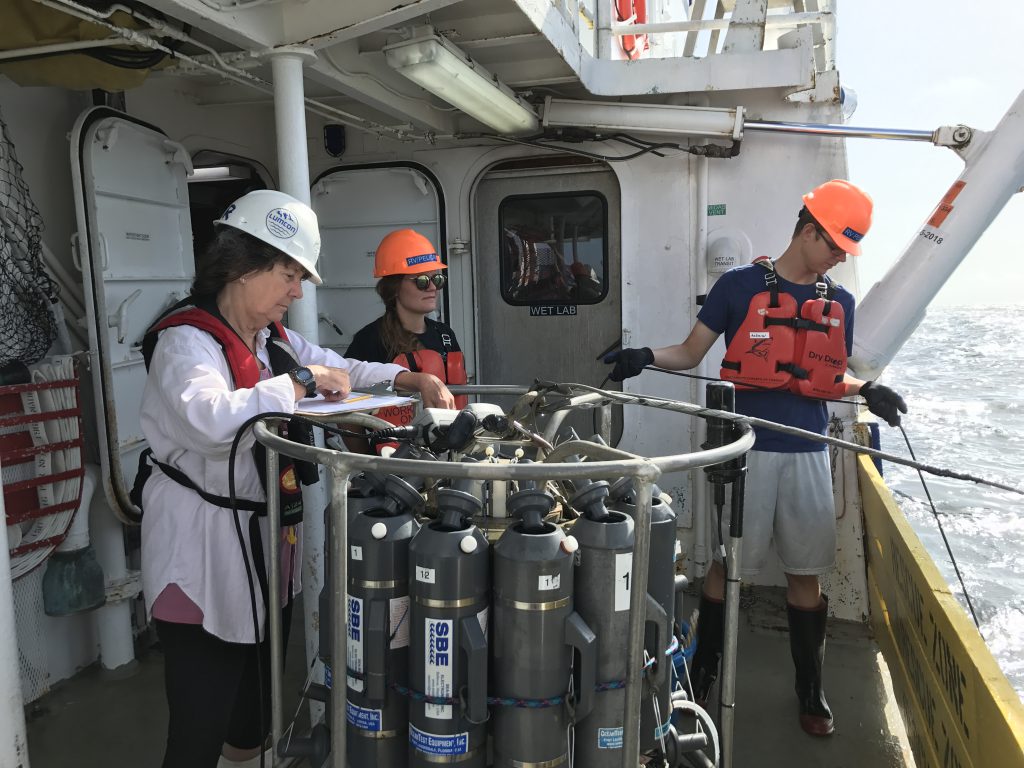
The measured size of the dead zone, also called the hypoxic zone, is the eighth largest in the 33-year record and exceeds the 5,770-square-mile average from the past five years. Scientists at Louisiana State University and the Louisiana Universities Marine Consortium (LUMCON) led the annual survey during a research cruise from July 23 through July 29 aboard the LUMCON R/V Pelican.
In June, NCCOS supported scientists forecasted a near historic hypoxia area of 7,829 square miles, close to the record size of 8,776 square miles set in 2017. However, the models do not take storms into account. This year, the passage of Hurricane Barry prior to the research cruise helped mix the water column over the Louisiana shelf, which proved to be a temporary disruption to the hypoxic zone that had already formed. The hypoxic zone usually returns once the water column is able to restratify after a storm. Exposure to hypoxic waters has been found to reduce the reproductive capabilities of some fish species and slow shrimp growth, leading to reductions in the average size of shrimp.
The Mississippi River/Gulf of Mexico Hypoxia Task Force uses the annual hypoxic zone size determination as a key metric to measure progress toward achieving the five-year average target of 1,900-square-miles or smaller by 2035. As the survey cruise is only a snapshot of the hypoxic zone, calculating a 5-year average captures the true dynamic nature of the zone more than a single measurement.

Data from this cruise are used by NCCOS and its partners to help refine the models so they can more accurately simulate the relationships between river discharge, nutrient loads, and oceanographic conditions that can cause and sustain hypoxic conditions. NCCOS also continues to study the impacts of hypoxia on fish and fisheries in the Gulf of Mexico through its Northern Gulf of Mexico Ecosystems and Hypoxia Assessment program, known as NGOMEX.
For more details on the 2019 dead zone and previous year dead zones, see the NOAA Press Release and LUMCON’s Gulf Hypoxia website.
A post-cruise press teleconference was held on August 1, 2019.
